


The impact of Covid-19 on the public and health expenditure gradient in mortality in England
University of Nottingham
School of Economics
MSc Economic Development and Policy Analysis
Author: Alexander Waller
Supervisor: Dr Jake Bradley
Student ID: 14322891
Academic Year: 2021-22
This Dissertation is presented in part fulfilment of the requirement for the completion of an MSc in the School of Economics, University of Nottingham. The work is the sole responsibility of the candidate.
Contents
1. Introduction…………………………………………………………………………………………………
2. Data and Measurement ………………………………………………………………………………..
3. Background of Covid-19 in the United Kingdom ……………………………………………..
4. The importance of public and health care spending for life expectancy and health
outcomes …………………………………………………………………………………………………………
5. The impact of Covid-19 on the public and health expenditure gradient in mortality
in England ………………………………………………………………………………………………………..
Two-Stage-Least-Squares Model ……………………………………………………………………………….. 28
Rural-Urban Effect on Mortality …………………………………………………………………………………. 36
6. Strengths and Limitations ……………………………………………………………………………
7. Conclusion …………………………………………………………………………………………………
Bibliography ……………………………………………………………………………………………………..
1. Introduction
The Covid-19 pandemic has seen unprecedented global levels of mortality, with just over 5.4 million total deaths attributed to Covid-19 up to 2nd January 2022 (WHO, 2022). In addition, the total excess mortality associated with the Covid-19 pandemic during 2020 and 2021 has been estimated at roughly 14.9 million people (Rosengren, 2022). Excess mortality is a measure of the number of deaths above the expected amount. England contributed roughly 860,000 total deaths and 150,000 Covid-19 deaths towards the global figures with the National Health Service (NHS) put under severe pressure trying to cope with the vast number of people admitted to hospital; roughly 550,000 people were admitted to hospital for Covid-19 in 2020 and 2021 (UKHSA, 2022a). In particular, 63% of those with long-term health conditions did not receive NHS treatment in April 2020 as a result of appointment cancellations, and 56% of cancer patients had their NHS treatment cancelled or postponed (Benzeval et al., 2020). The number of patients in hospital in January 2021 peaked at roughly 335,000 people and the total strain on the NHS has resulted in longer wait times in Accident and Emergency (A&E) departments
and for other appointments.
The UK had the fourth highest excess mortality rate of 33 Organisation for Economic Co-operation and Development (OECD) member countries with comparable data in 2020, which was largely attributed to the relative timing of lockdown restrictions (Suleman et al., 2021). The failure of healthy life expectancy to keep up with overall life expectancy in the UK is likely a factor that resulted in those aged 85 and older accounting for 41% of all deaths during the first wave in 2020 (White, 2022, Caul, 2022). Underlyinghealth conditions have been foundto increase the mortality risk from a Covid-19 infection, including the level of deprivation an individual lives in (Atkins et al., 2020, Biswas et al., 2021, Cho et al., 2021, Williamson et al., 2020). Research has also shown
significant geographical heterogeneity in Covid-19 mortality, particularly through the income gradient in excess mortality and other socioeconomic factors (Papageorge et al., 2021, Decoster et al., 2021, Breen and Ermisch, 2021). Even for younger people aged 65 or less, the 10% of young people living in the most deprived areas experienced a Covid 19 mortality rate 4 times greater than those living in the least deprived areas (Suleman et al., 2021).
While the most deprived areas appear to have had the greatest mortality risks from Covid-19, ethnic minority groups were also disproportionately affected after adjusting for socioeconomic and health factors, and level of deprivation. Ethnic minority groups experienced worse mortality rates compared to White ethnic groups and key
workers receive higher levels of inadequate PPE in comparison to their White colleagues (Ahmed et al., 2022a, Haque et al., 2020, Larsen et al., 2021). Pre-pandemic trends showed that White ethnic groups experienced higher rates of excess mortality, suggesting that the environmental and socioeconomic factors faced by ethnic minority
groups were disproportionately exacerbated by Covid-19 in comparison to White ethnic groups. Geographical differences in the level of deprivation are of particular interest in England given that Local Authority spending aims to provide services to reduce inequalities that exhibit geographical heterogeneity. Adult and child social care provides support and care to at-risk individuals – whether it is the result of old age, disability, or other health conditions – constituting just under 60% of all Local Authority spending in England (Harris et al., 2019). Increasing demand for adult social care, driven by an increase in the number of years lived in poor health has not been met by rises in Local Authority funding and spending (Harris et al., 2019, White, 2022). Local Authority spending for adult social care has fallen by 7% in nominal terms from 2009 to 2020, and overall spending has fallen by 37%, on average. This has been largely due to changes in how central government grants are allocated to Local Authorities, such that the most deprived areas have experienced the largest cuts in grant funding – these are areas that spend relatively less on adult social care. Despite the cuts to Local Authority spending, it is an important factor in reducing the all-cause excess mortality rate. In contrast, NHS Clinical Commissioning Group (CCG) funding is found to be positively associated with the excess mortality rate, but this appears to be a consequence of poor health and old age factors that require greater levels of funding per person.
The endogeneity issues surrounding NHS CCG funding when analysing its effect on the all-cause excess mortality rate required the use of an Instrumental Variables approach. The weighted population formulae for funding allocations outline that a greater number of elderly people in an area, as well as poorer health outcomes, require
greater levels of funding per person (NHS_England, 2021b). However, old age and income – that are both associated with poor health – cannot be used as instruments for NHS CCG funding. They both violate the exclusion restriction, given their association with greater mortality risk, especially from Covid-19 (Chetty et al., 2016, Wellard, 2022, Yanez et al., 2020). Therefore, historical NHS CCG funding was used as an instrument,
assuming that it is a good predictor of future levels of funding.
The remainder of this dissertation will be structured as follows. Section 2 describes the data and explains how the data was adjusted to allow for this analysis to be carried out at the Local Authority level. Section 3 outlines the progression and severity of Covid-19 throughout 2020 and 2021, as well as the government’s policy
responses. Section 4 focuses on the importance of health and social care spending for life expectancy and health outcomes, while also describing how spending has changed over the past decade. Section 5 presents the findings of the analysis and interpretation of the results, including the context and mechanisms that influence the outcomes. Two models are used in this section to compare the effects controlling for population density and rural-urban classifications. Section 6 discusses the strengths and limitations of the approach taken in this dissertation and Section 7 concludes.
2. Data and Measurement
In this paper, various datasets at the Lower-Tier Local Authority (LTLA) level and the NHS CCG level were matched using NHS CCG and LTLA-level identifiers. There are 337 LTLAs in the dataset and each of them is assigned to one of 106 CCGs. Most of the data is available through the Office for National Statistics (ONS), NHS England and the Ministry of Housing, Communities and Local Government.
Local Authority spending data is largely broken down into Lower-Tier and Upper Tier spending depending on whether an area is two-tier or single-tier. In single-tier areas, one authority provides all services for the area and carries out all other local government functions. Two-tier areas share local government functions, such that
county councils and district councils provide different services to their respective areas (Paun et al., 2022). As a result, Local Authority data for single-tier areas included both Upper- and Lower-Tier spending, while data for two-tier areas included the Lower-Tier spending for each district council and then a single Upper-Tier spending value for all district councils within their respective county council. For these smallest-level ‘Shire
Districts’ that are all two-tier areas, the county council spending data was assumed to be distributed proportionally by population size to better compare total spending on services between each Local Authority, regardless of whether they are single- or two tier areas.
There is large variation in the main characteristics of Local Authorities such as population size, density, and rural urban classification. Population sizes ranged from 1,420 to 1,112,305 people in 2015, and population density varied from 25 people per km2 in more rural areas to 16,425 people per km2. The large variations in population sizes are a result of multiple NHS CCG area boundaries overlapping with Local Authority areas that consist of many ‘Lower Layer Super Output Areas’ (LSOAs). These are smaller areas of similar population sizes, with an average of 1,500 residents or 650 households (DLUHC, 2015). In some cases, such as Preston, only one LSOA is in the NHS Fylde and Wyre CCG, while all other LSOAs are in the NHS Greater Preston CCG. These within LocalAuthority differences are important to include in the dataset as there are other Local Authorities that are split relatively evenly between two NHS CCGs, such as Sefton which has over 100,000 people living in each CCG area.
Brandily et al. (2021) explain that much of the literature on the impact of the Covid-19 pandemic on mortality is based upon confirmed Covid-19 cases or deaths and this method often leads to an underestimation of the pandemic’s true effects on total mortality. Lockdowns and pressures on healthcare services meant that many people who required healthcare were not able to access it, as resources were severely limited given the large number of hospitalisations, especially in 2020. In addition, they conduct an extensive review of the biases in the literature regarding measures based on COVID 19 reported cases. They note that variations in testing capacities between, and especially within, countries over time make it very difficult to compare the true effects of Covid-19. Furthermore, when there is limited testing capacity it is often prioritised for those with suspected infections, leading to overestimations of the true infection rate of the general population. The indirect effects of the pandemic on mortality – deaths that are a result of the pandemic as a whole but cannot be directly attributed to a Covid-19 infection – are considered the most important limitation of Covid-19 infection and death data by Brandily et al. (2021), who use all-cause mortality data instead. They expand on this by using all-cause excess mortality rates based on an average expected mortality rate from 2018 and 2019, at the municipality level.
As there were many discrepancies in the number of reported and expected deaths between institutions in England, and in how deaths are reported – deathoccurrences or registrations – this analysis uses data solely from the Office for National Statistics for monthly all-cause mortality at the Lower-Tier level from 2015 to 2021. They calculate their expected annual mortality based on a 5-year average to reduce the extent of single year outliers on expected deaths. For both 2020 and 2021, ONS use data from 2015 to 2019 for their expected deaths, so monthly values were used to calculate expected mortality rates for the period end of March 2020 to the end of December 2021. Most of the mortality data for 2020, with respect to Covid-19, begins from 25th
March 2020, the start of the first lockdown in England. Therefore, data for January, February and part of March are excluded from calculations for 2020 expected deaths, as these months have greater historical levels of mortality compared to non-winter months. This was done so that counterfactual mortality is not biased for the 2020 period. The total all-cause and expected mortality data is then used to calculate the mortality rates per 10,000 people for all Local Authorities, using population data at the LSOA level to account for Local Authorities that reside in multiple NHS CCG areas. The difference between total all-cause mortality and expected all-cause mortality rates are finally used to determine the excess all-cause mortality rates per 10,000 people. More formally, the excess all-cause mortality rate is defined as:
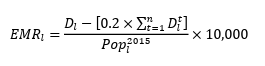

where 𝐸𝑀𝑅𝑙 and 𝐷𝑙 are the all-cause excess and total mortality rates, respectively, in LTLA 𝑙 for 2020 and 2021. 𝑡 is the five-year period 2015-2019 used to calculate counterfactual mortality. 𝐷𝑙 𝑡 is the number of deaths for each year 𝑡, excludingJanuary to March for the 2020 counterfactual. 𝑃𝑜𝑝𝑙 2015 is the total population size for
each Local Authority 𝑙 in mid-2015, excluding prisoners. The excess mortality rate for 2020 is then adjusted to represent an annual mortality rate. This all-cause excess mortality measure is unaffected by Covid-19 data reporting biases that exist over time for each Local Authority. The average mortality rates for 2020 and 2021 are combined to create an average mortality rate for the full sample period.
Table 1 presents the summary statistics for the variables used in this analysis. The all-cause excess mortality rateper 10,000 ranged from -0.66 to 28.155, with a mean of 14.166 excess deaths per 10,000 people. There was only one Local Authority with a negative excess mortality rate, defined as fewer deaths than expected based on the previous 5-year average. Torridge in the South West region of England saw a negative excess death rate that totalled 11 fewer deaths than expected, with 20 fewer excess deaths in 2021 and 9 more in 2020. Barnsley in Yorkshire had the highest excess death rate at 28.155 more deaths than expected per 10,000 people, even though its share of the population aged 60+ was roughly the mean share for all Local Authorities. Interestingly, both areas had a similar mean annual gross pay in 2019, despite the large difference in their excess mortality rates. Barnsley’s level of NHS CCG funding allocation per person has been on average, £164.70 higher than that of Torridge from 2015 to 2022. However, these two Local Authorities have seen drastically different falls in their spending levels per person between 2015 and 2019. Barnsley has seen reduction of 15.79%, or £273 spent on each person, while Torridge’s spending has only fallen by 0.3%, or £4.52 in the same period.
Summary Statistics
Table 1: Summary Statistics 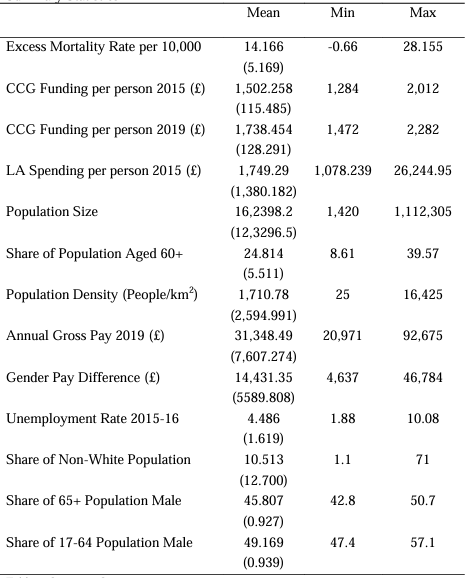

While it is interesting to note the differences at the extreme ends of the excess mortality, there does not appear to be any initial clear trend between the regions in England, or rural-urban classification, and the change of Local Authority spending, or NHS CCG funding, over time. Furthermore, there does not appear to be an apparent initial relationship between income and the levels of Local Authority spending or NHS CCG funding, nor changes in their levels over time. This analysis builds on the literature examining the effect of income on mortality resulting from Covid-19 by examining whether historical Local Authority spending and NHS CCG funding allocations influence all-cause excess mortality rates during the pandemic.
3. Background of Covid-19 in the United Kingdom
From 23rd March 2020 to 31st December 2021, there were just over 860,000 deaths, with roughly 150,000 deaths registered to be a result of Covid-19 or a recent Covid-19 infection. Furthermore, there were approximately 130,000 excess deaths based on the above expected mortality figures. As expected, 2020 was the largest contributor to both Covid-19 and excess deaths and the mortality rate fell in 2021. This can be partly attributed to the vaccination roll out that began in early December 2020 and targeted those aged 80+, followed by healthcare workers in mid-January 2021 (NHS_England, 2020) (NHS_England, 2021a). The vaccinations continued to be distributed to subsequent age groups through to mid-June 2021, to protect the elderly who were at greater risk in the case of infection. Additional third vaccination doses were given to the most vulnerable groups from September 2021, to minimise the chances of serious complications from infection (Knapton, 2021).

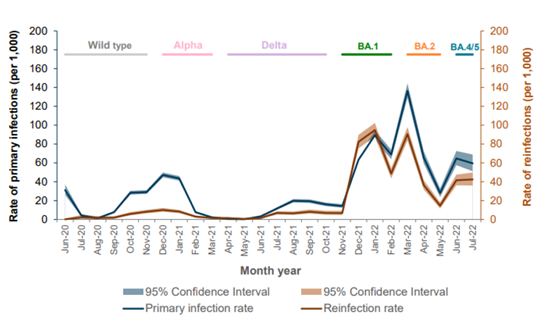
However, with increasing protection against Covid-19 came several variants of concern. The first was the Alpha variant that was found to have a 52% greater risk of leading to hospitalisation and 59% greater risk of death within 28 days of an infection, compared to the first strain found in early 2020 (Nyberg et al., 2021). On 6th May 2021, the Delta variant was declared as the second variant of concern in the UK (Sandle and Smout, 2021) and was found to be 40 to 60% more transmissible than the Alpha variant (SAGE, 2021), 85% more likely to lead to hospitalisation (Sheikh et al., 2021), and had a 64% greater risk of mortality (Challen et al., 2021). Finally, the first Omicron variant was detected in the UK on 27th November 2021, originating from South Africa, which had a relatively positive outlook regarding Covid-19 infections (Pitas et al., 2021). Omicron has a 59% lower risk of hospitalisation and 69% lower risk of death than confirmed Delta cases (Nyberg et al., 2022). The differing levels of severity means it is difficult to use Covid-19 mortality as a form of comparison between years and for determining the true effect of the pandemic on mortality.
In addition to the Covid-19 variants, there were also various levels of restrictions on the public that began in March 2020 and ended in February 2022, that aimed to limit the spread of the virus (Haddon et al., 2021). The first national lockdown was introduced on the 26th March 2020 and restrictions were slowly eased from 10th May until 22nd September, except for some local lockdowns that began on 4th July. The second national lockdown began on 14th October 2020 and ended 2nd December, although social restrictions were still in place to limit the spread of the Alpha variant. The third and final national lockdown began on 6th January 2021 with indoor social gathering restrictions easing from 17th May and all social restrictions eased on 19th July 2021. In the winter of 2021, there were some legal restrictions introduced for indoor venues, such as compulsory facemasks, that aimed to limit the spread of the much more transmissible Omicron variant and the strain on the NHS. 94.5% of adult beds were occupied in hospitals on 19th December 2021 (Gallagher, 2021), with a peak of 50,295 NHS staff absent with Covid-19 infections on 31st December 2021.

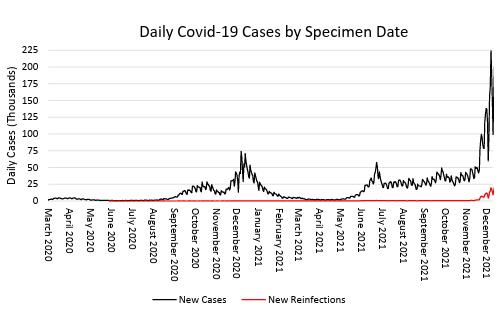

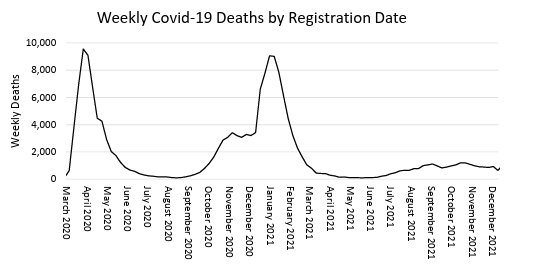
As shown in Figure 2 and Figure 3, the number of cases does not reflect the total vnumber of deaths. This is partly due to the testing biases outlined previously and the varying risk of serious infection with each Covid-19 variant of concern. Furthermore, Figure 2 shows a steady increase in the number of cases beginning in July 2021, but the trend in weekly deaths does not follow the same trend in the number of cases. In addition, the lack of infections in the first few months of the pandemic in 2020, resulting from constrained testing capacity, means that infections are not a very good predictor of the number of deaths for the full sample period; this would result in biased or invalid estimations. The vaccination program also reduced the likelihood of severe infection and dying from an infection, altering the ability to compare Covid-19 infection and mortality rates over time.
Despite the various policy responses by the UK government to each infection wave, the UK had the fourth highest excess mortality rate of 33 OECD countries with comparable data in 2020. This was largely attributed to the timing of lockdown restrictions compared to other countries (Suleman et al., 2021). Consequently, the vast
number of infections led to substantial strain on NHS services, with the number of patients waiting for a routine hospital appointment for longer than 52 weeks almost reaching 200,000 in January 2021 (Perry, 2021). Furthermore, high numbers of Covid-19 cases resulted in reduced hospital and clinic capacity, and had been put under further pressure with increasing numbers of staff absences related to Covid-19 (Edwards, 2020, Scobie, 2021). Cancellations of appointments for those with long-term health conditions, including cancer patients, could lead to knock-on effects on mortality that are an indirect result of the Covid-19 pandemic (Benzeval et al., 2020).
Quicker lockdown responses to rising infection numbers could have reduced the higher excess mortality rates for more deprived areas when compared to less deprived areas, as well as reducing the pressure on the NHS. People living in worse conditions, or greater levels of deprivation, have been found to have worse underlying health, leading to Covid-19 mortality rates 3.7 times higher in the most deprived areas, for those younger than 65. Despite significantly higher Covid-19 death tolls for the elderly, other factors such as deprivation, underlying health and socioeconomic factors appear to explain a large proportion of the differences in excess mortality rates between areas in the same country. (Atkins et al., 2020, Biswas et al., 2021, Cho et al., 2021, Williamson et al., 2020, Breen and Ermisch, 2021, Decoster et al., 2021, Papageorge et al., 2021).
4. The importance of public and health care spending for life expectancy and
health outcomes
Previous literature has focused on the effect of geographical heterogeneity in income levels on mortality rates, such as research by Brandily et al. (2021) on the income gradient in mortality from Covid-19. Using a difference-in-difference method, they found that the poorest quartile of municipalities saw slightly more than 2.5 additional excess deaths per 10,000 people than all other municipalities. Their results are also robust to different infection waves, age, gender, and the exclusion of care home deaths from their sample. For this dissertation, a different approach will be used to determine the effect of Local Authority and NHS CCG funding on mortality during the Covid-19 pandemic. An instrumental variables (IV) approach was used for NHS CCG funding due to potential endogeneity issues regarding how NHS CCG funding is allocated. This approach is used when endogenous regressors lead to biased or inconsistent estimates due to the regressor being correlated with the error term in the model. An instrument can be used to solve this endogeneity problem, provided that the instrument is associated with the regressor but not the error term, and does not have a direct effect on the outcome variable; the instrument is correlated with the regressor, which in turn determines the outcome variable.
In this analysis, historical NHS CCG funding is as an instrument, assuming it is a good predictor of future funding levels. According to NHS England, CCG Funding allocations are determined by a weighted population that leads to greater levels of funding the larger the share of older people given that they have a greater need per person (NHS_England, 2021b). Areas with poorer health also require a greater level of funding per person. The number of people aged 60+ and average income in a given Local Authority as instruments for NHS CCG funding were ruled out as they would both violate the exclusion restriction of IV estimations; they both have an effect on excess mortality rates that is not solely due to their impact on funding levels. Chetty et al. (2016) explain that there is an association between income and life expectancy in the United States. The Office for National Statistics has also found that individuals living in more deprived areas experienced higher rates of avoidable mortality in 2020 than individuals living in less deprived areas (Wellard, 2022). Therefore, income is not a good instrument for NHS CCG funding as it directly affects excess mortality rates.
The number of people aged 60 and over was also ruled out as an instrument due to the direct link to mortality rates, especially to Covid-19 mortality rates. Compared to those aged 54 and younger, the mortality rate was 62 times greater for people aged 65 and over (Yanez et al., 2020). Even though greater mortality risk for older people is partly taken into account by the expected mortality rate in a given local authority, the significantly greater risk of mortality directly caused by a Covid-19 infection means it would not be a valid instrument. Although there are some annual adjustments to NHS CCG funding levels resulting from demographic changes over time, future funding levels largely increase at the same rate per person in England, in a given local authority.
Due to the differences in how NHS CCG funding and Local Authority spending are determined, the latter was not considered to be an endogenous regressor that needed to be instrumented for. Local Authorities spend their funds on a variety of different services so the effects on mortality rates are more indirect in comparison to NHS CCG funding. Children and adult social care accounts for just under 60% of all Local Authority spending, while the remaining spending is on services that cover public health, housing, planning, environment, transport, culture-related activities, and central-operating costs (Harris et al., 2019). Only 7% is spent on public health services, which mostly aims to reduce health inequalities, provide sexual health services and services to reduce alcohol and drug abuse. NHS England is responsible for most of public health spending, and more is spent on management and treatment of health conditions than on welfare measures.
Children’s social care is a vital area of Local Authority spending because it can have long-term health and education implications for children who are unable to access it. Meyers et al. (2004) explain that childcare services have an important and positive impact on children’s development when they are young, in the form of greater pre academic outcomes, and language skills that better prepare them for when they begin their formal education. Although their research was conducted in the United States, the findings are still valid for the United Kingdom since the availability and affordability of childcare services has the greatest impact on low-income families. This is a result of the greater developmental disadvantages faced by children from low-income families, and greater spending on children’s services by Local Authorities helps to reduce this. Improving children’s prospects for future income will help increase their life expectancy, given the association between income and life expectancy (Chetty et al., 2016).
Another, more relevant, way in which children’s services spending is important for this analysis on excess mortality rates is through the parental income channel. Greater provision of childcare services by Local Authorities has a vital impact on female earnings, mostly through the impact on employment rates. Only 40.5% of women with one child work full-time, compared to just under 80% for men, and the full-time employment rate forwomen decreases with more children (Hochlaf and Franklin, 2021). Local authorities with the highest levels of childcare provision had an 11-percentage point higher overall employment rate for women than the local authorities with the lowest levels of childcare provision. Increasing the availability of childcare services will greatly benefit two-parent households by increasing total household income, as more mothers are able to work a full-time job, or increase their working hours. Increasing access to children’s services to improve female employment rates will have a greater impact on reducing avoidable mortality in the shorter-term, compared to the long-term improvements to children’s future health outcomes.
Adult social care is perhaps the most important channel through which Local Authority spending influences mortality rates, as it consists of providing support to all adults who require care, support, or other services at home. It also includes the provision of care homes, ‘assisted living’ houses, and paying staff to support those living there. As a result, higher levels of spending on adult social care reduces the likelihood of hospitalisations and also the strain on the NHS, mostly through lowering the risk of injuries to the elderly – “hip fractures alone cost the NHS almost £2 billion each year” (LGA, 2019). This is a more preventative measure to improve health outcomes and the benefits of these services can be seen in the short-term. However, the 7% fall in
spending on adult social care from 2009-2020 will likely have had a longer-term effect on health outcomes for the elderly, even though 38% of all Local Authority spending is on adult social care (Harris et al., 2019). Social isolation due to lockdowns and restrictions on socialisation throughout most of 2020 and 2021 could have had an indirect effect on mortality rates, particularly for the 3.1 million people aged 65 and over that lived alone in 2018-19 – twice the rate of younger age groups (Lewis, 2021).
A study by Stafford et al. (2018) found that care for those with 2 or more medical conditions accounts for over half of primary and secondary care costs for the NHS, and roughly 75% of all primary care prescriptions. The disparity in health outcomes between the least and most deprived areas emphasises the health inequalities in England, as those living in the least-deprived fifth of areas are expected to have 2 or more conditions by the time they are 71 years old. Those in the most deprived fifth are expected to reach that point by the time they are 61 years old. Those living in the most deprived areas reaching the same level of illness a decade sooner than the least deprived areas is an uncomfortable discrepancy in the healthy life expectancy of the elderly. This variation, however, is not only limited to geographical factors.
In 2015 to 2017, males had a healthy life expectancy at birth that was half a year shorter than for women, but this gap has closed since 2009 to 2011, as men have gained 6 months and women have lost 3 months of healthy life expectancy (Pratt, 2018). The gender difference emphasises a worse picture for the elderly and when combined with geographical differences in the UK, healthy life expectancy varies by 21.5 years and 15.8 years for women and men, respectively. The disability-free life expectancy at birth in England has also fallen in recent years and women have seen a greater decrease of 1.2 years compared to men, 0.7 years (White, 2022). Furthermore, this fall, in combination with increasing life expectancy, has led to an increase in the expected number of years lived with disability, a greater increase for women compared to men. Advancements and innovations in healthcare are allowing people to live longer, but the expected number of years lived in ill health or with a disability is increasing; healthy life expectancy has been increasing at a slower rate than overall life expectancy in recent years.
Although spending on health and social care for the elderly is a key focus for the NHS and Local Authorities, 30% of people with 4 or more medical conditions are under the age of 65 and are disproportionately concentrated in more deprived areas. In addition, the number of people with multiple health conditions is expected to increase over the next five years such that it would require an increase in healthcare funding of £4 billion, with total hospital activity expected to increase by 14% (Stafford et al., 2018). Taking steps to improve healthy life expectancy through higher levels of spending on pre-emptive, or preventative, healthcare measures will help reduce the number of people with multiple conditions, provided that the spending is targeted towards more deprived areas. This, however has not been the case as the most deprived Local Authorities in England have seen the largest cuts to central government grants due to the way in which their funding has changed over the last decade (Figure 4).

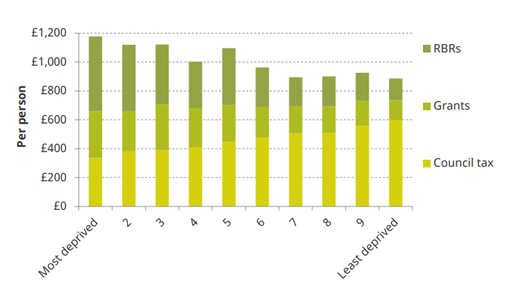
Since 2009-10, the funding system for local councils has changed from a needs based assessment to a less redistributive system that is mostly a result of more deprived areas generating fewer funds from council taxes. Government grant revenues for Local Authorities are determined using a set of multipliers based on the class of Authority and the council tax they generated in the previous year, so more deprived areas that generate less in council tax revenues receive proportionately lower government grant revenues (DLUHC, 2019). Harris et al. (2019) describe the differences in funding sources for the most and least deprived areas. The most deprived areas receive £842 per person from Retained Business Rates (RBR) and grant funding, and £336 per person from council tax revenues. The least deprived areas receive £288 per person from RBR and grant funding, and £599 per person from council tax revenue. Even though more deprived areas have higher levels of revenue per person, the needs of councils in different deprivation deciles vary significantly. More deprived councils spend a smaller proportion of the overall revenue on adult social care, and more on public health and children’s social services. The 37% fall in Local Authority spending per person from 2009 2020, on average, has resulted in relatively larger reductions in spending on services for more deprived councils, widening the inequalities in health and socioeconomic factors over time. The inequalities in funding and spending reductions are an important consideration for health outcomes with respect to the Covid-19 pandemic.
5. The impact of Covid-19 on the public and health expenditure gradient in
mortality in England
Due to the differences in the all-cause excess mortality rate in 2020 and 2021 within a given Local Authority, this analysis will focus on the effect of historical Local Authority spending and NHS CCG funding on the average excess mortality rate. A linear-log IV model will be used with cluster-and-heteroskedasticity-robust standard errors so that the estimator is robust to heteroskedasticity and any intra-cluster correlation. Since the number of instruments is equal to the number of instrumented variables, a Generalised Method of Moments (GMM) estimator is equivalent to that of Two-Stage-Least-Squares (2SLS). The 2SLS estimator can be defined as:
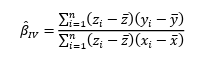

where 𝑧 is the exogenous regressor – the natural log of NHS CCG funding per person in 2015, ln(𝐶𝐶𝐺15). 𝑥 is the endogenous regressor ln(𝐶𝐶𝐺19) and 𝑦 is the outcome variable, 𝐸𝑥𝑐𝐷𝑅, the all-cause excess mortality rate. The 2SLS estimator is only valid if it satisfies two conditions:
The (z,u)=0
cov(z,u) ≠ 0
The reduced-form first stage regression is defined as: 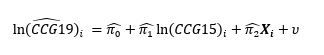

where 𝑖is a Local Authority indicator and 𝑿𝒊 is a matrix of the excluded exogenous variables. The estimate of ln(𝐶𝐶𝐺19) is then used in a second stage regression to determine the effect on the all-cause excess mortality rate. If it is confirmed to be an endogenous variable then the estimates and standard errors produced by this 2SLS method will be more consistent and efficient than the OLS estimates. The second-stage regression is defined as:
~
m𝑅𝑎𝑡𝑒𝑖 = 𝛼+𝛽1ln(𝐶𝐶𝐺19)̂ 𝑖+𝛽2ln(𝑂𝑙𝑑)𝑖+𝛽3ln(𝐿𝐴𝑆𝑝𝑒𝑛𝑑15)𝑖 +𝛽4ln(𝑃𝑎𝑦)i ̂
+𝛽5ln(𝑃𝑎𝑦𝐺𝑎𝑝)𝑖 +𝛽6ln(𝑆𝑖𝑧𝑒)𝑖 + 𝛽7ln (𝑈𝑛𝐸𝑚𝑝)𝑖 +𝛽8ln( 𝐷𝑒𝑛𝑠𝑖𝑡𝑦)i
+𝛽9ln(𝑁𝑜𝑛𝑊ℎ𝑖𝑡𝑒)𝑖 +𝛽10ln(65𝑃𝑜𝑝𝑀𝑎𝑙𝑒)+𝛽11ln(𝑢65𝑃𝑜𝑝𝑀𝑎𝑙𝑒)
+𝜖𝑖
All models used in this dissertation include the following variables as controls: population size (𝑆𝑖𝑧𝑒) and density (𝐷𝑒𝑛𝑠𝑖𝑡𝑦) due to their effect on either the spread of Covid-19 through the general population, the population aged 60+ (𝑂𝑙𝑑), gross annual pay (𝑃𝑎𝑦), gender pay difference (𝑃𝑎𝑦𝐺𝑎𝑝), the unemployment rate for 2015-16
(𝑈𝑛𝐸𝑚𝑝), the share of the Local Authority’s population that is non-white (𝑁𝑜𝑛𝑊ℎ𝑖𝑡𝑒), the share of the 65+ population that is male (65𝑃𝑜𝑝𝑀𝑎𝑙𝑒), and the share of the 17-24 population that is male (𝑢65𝑃𝑜𝑝𝑀𝑎𝑙𝑒). Cooper et al. (2006) and McLeod et al. (2012) both explain the negative effect of unemployment on health, and the size of the effect increases the longer an individual is unemployed. This is likely because of ‘unemployment scarring,’ such that the longer an individual remains unemployed, the more difficult it is for them to find employment. Between 2007 and 2020, even those i unemployment for 3 to 6 months were less likely to find a job in the next quarter than those who were unemployed for less than 3 months, by 9 percentage points (Vassilev,
2021). The effect also becomes slightly larger for ethnic minorities, given the same amount of time in unemployment. Furthermore, the likelihood of returning to work declines with age, as only 12.2% of people in their 50s returned to work within three months.
Young people experienced the largest consequences of long periods of unemployment, even though they are much more likely to find another job within 3 months than all other age groups. Longer periods of unemployment resulted in lower future earnings and had a two-fold effect on health. Unemployment alone is associated with worse health outcomes (Cooper et al., 2006), and young people that see lower future earnings likely experience worse health as a result of the association between income and life expectancy. However, McLeod et al. (2012) explain that the welfare regime of a country can influence the negative effect of unemployment on health, such that a more supportive welfare-regime can reduce the effect of unemployment on health and mortality.
Members of ethnic minority groups experienced higher excess Covid-19 mortality rates than White ethnic groups, and the difference in the excess mortality rates between ethnic minority and White groups was mostly attributed to location, measures of disadvantages, occupation, living arrangements, and pre-existing health
conditions (Larsen et al., 2021). Although these factors accounted for a large proportion of the variation in the excess Covid-19 mortality risk, Black African men were still 1.7 to 2.2 times more likely to die from Covid-19 than White men. Overall, the Covid-19 mortality risk was greater for most ethnic minority groups throughout 2020 and 2021, which has been largely attributed to socioeconomic and health factors, as well as lower vaccination rates in some groups that experienced elevated Covid-19 mortality risks (Ahmed et al., 2022a). The increased mortality risk could also be linked to the greater risk of exposure to Covid-19, as more ethnic minority key workers reported that they were given not given adequate PPE compared to White colleagues. In particular, 50%, 42%, and 41% of Bangladeshi, Pakistani, and black African workers respectively, reported that they were given inadequate PPE (Haque et al., 2020).
The share of the 65+ population that is male was included in the model as men have a mortality risk 77% higher than women for all age groups, and those aged 65 and over have a mortality risk 62 times higher than those aged 54 and younger (Yanez et al., 2020). The share of the 17-64 population that is male was included to control for the varying mortality risk between age groups. Additionally, a gender pay difference variable was included to account for any income-related differences in mortality risk between genders, given the association between income and life expectancy (Chetty et al., 2016). It is also important to account for the difference in gender pay due to the large differences in full-time employment outlined previously regarding the provision of children’s social care and childcare services.
Two-Stage-Least-Squares Model
The estimation results from the first 2SLS model (Model b), can be seen in Table 3. This model rejects the null hypotheses of both weak-instrument-robust inference tests; the Stock-Wright Lagrange Multiplier S-statistic, and Anderson-Rubin Wald tests. The null hypotheses state that the coefficient of the endogenous regressor is equal to zero, and that the overidentifying restrictions are valid, meaning that the endogenous regressor ln(𝐶𝐶𝐺19) is valid. In addition, Model b also rejects the null hypotheses of the weak identification and under-identification tests and, since the F-statistic of the weak identification test is significantly larger than 10, ln(𝐶𝐶𝐺15) is considered to be a strong instrument in this model. Most importantly, the null hypothesis of the endogeneity test – that the endogenous regressor can be treated as exogenous – is rejected, and that ln(𝐶𝐶𝐺15) is a valid instrument for ln(𝐶𝐶𝐺19) which is an endogenous variable.
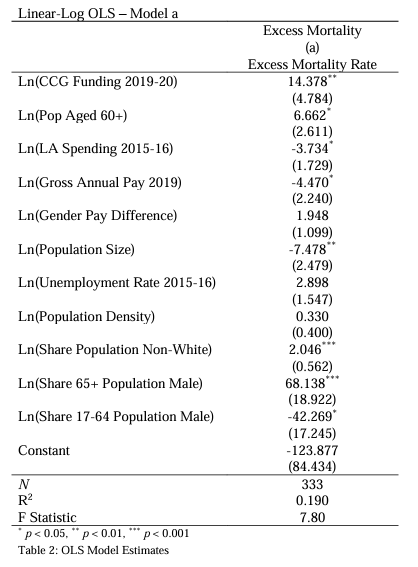

The results of the OLS estimations (Model a) can be seen in Table 2 and comparing the OLS and 2SLS (Model b) models shows that the 2SLS model is a more efficient estimator for the given model specification. This is expected considering that ln(𝐶𝐶𝐺19) is an endogenous regressor.
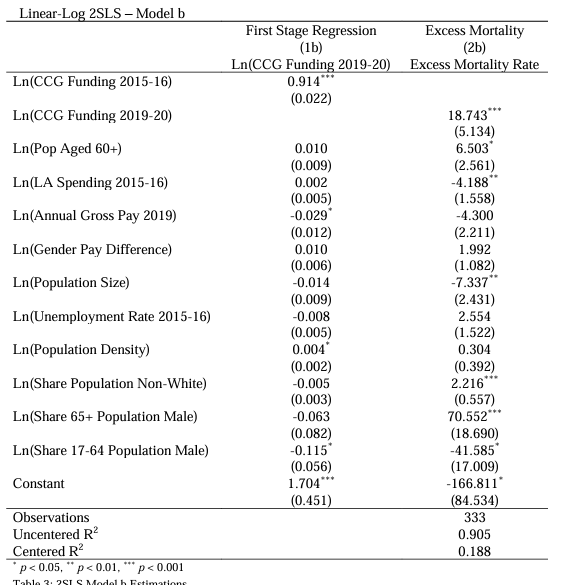

The linear-log model specification used in this analysis has the benefit of allowing for simple interpretation of the regression coefficients. A 10% increase in NHS CCG funding in 2019 is associated with an increase in the all-cause excess mortality rate of 1.874 deaths per 10,000 people. It is partly surprising that the level of NHS CCG funding is associated with an increase in the excess mortality rate, but areas with higher levels of healthcare spending often have poorer health (NHS_England, 2021b). This relationship between funding and the level of health of a given area makes the interpretation of this finding more difficult. Since areas with poorer health have greater
relative healthcare needs, there will be more funding allocated to those areas. Areas with higher levels of healthcare funding will therefore appear to have worse excess mortality rates in this analysis, but this is a result of the underlying poor health rather than healthcare spending itself. Furthermore, it is difficult to determine what the excess mortality rates would have been for a given Local Authority with poor health, if they had lower levels of funding.
Finally, while there is a positive association between NHS CCG funding and the excess mortality rate, it does not mean that more healthcare spending per person leads to worse mortality rates because of the underlying reverse causality between them. James et al. (2017) provide support for this and explain that a 10% increase in healthcare
spending in OECD countries is associated with an increase in life expectancy of 3.5 months, between 1995 and 2015, and that similar rates of improvements in healthier lifestyles is associated with a gain of 2.6 months. However, Watt et al. (2019) outline that, from 2014 to 2020, there has been a 25% reduction in real spending on public health and this is not meeting the needs of an aging population that is developing chronic illnesses at an increasing rate, illnesses that require increasing levels of NHS support.
A 10% increase in Local Authority spending in 2015 is associated with 0.419 fewer deaths per 10,000 people. Furthermore, when estimating the effect of more recent spending in 2019 instead, the effect on excess mortality increases to 0.440 fewer deaths per 10,000 people even though the average nominal amount spent per person for all Local Authorities in 2019 was 2.64% lower than in 2015. This is even lower when considering the real change in spending. We can infer from this that spending on services provided by Local Authorities has a slightly larger short-term effect in reducing the excess mortality rate, despite the nominal and real fall in spending levels. This is perhaps most likely transmitted through adult social care and the positive health benefits that it creates for the older population – those most at risk of dying from Covid-19 infections.

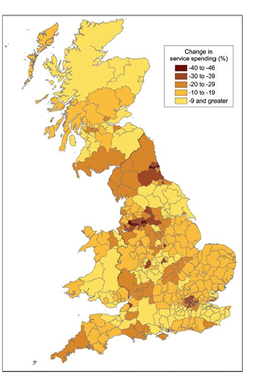
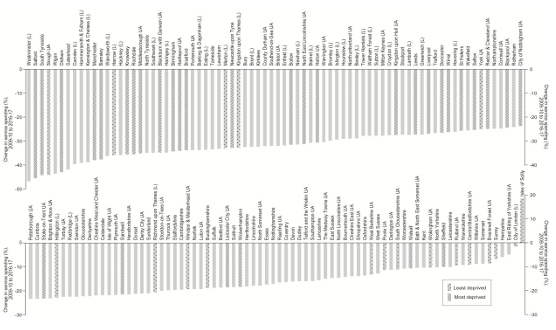
Findings by Gray and Barford (2018) provide support for the benefit of greater levels of spending by Local Authorities, but also explain that the inequalities in spending reductions throughout the UK result from austerity policies. Figure 5 shows the large variation in service spending cuts throughout the UK and, although their data for England excludes public health and some social care spending, the most deprived areas have seen the largest cuts to service spending. This is also seen in Figure 6. These cuts to services have been found to increase the mortality rate for those aged 60+, and cuts to both public health and social care spending from 2010 to 2014, was associated with 45,000 excess deaths between 2012 and 2014 (Watkins et al., 2017).

The direction of the effect of income on excess mortality is as expected, however it is surprising that the estimated effect is not statistically different from zero. It is possible that the health effects of lower incomes are partially absorbed by ethnicity, gender ratios, and healthcare spending between Local Authorities, as these are all
factors that can affect mortality rates. The effect of the gender pay difference was also found to be statistically insignificant, which contradicts the hypothesis that excess mortality would increase with the gender pay difference. It is also possible that the effect is greater when looking at the historical difference, considering the gender pay gap in the UK has been decreasing over time, from 12.6% in 2008 to 7.4% in 2020. The variation in the gender pay gap still remains problematic, and the biggest pay gap within the UK was as large as 15.5% in 2020 (Smith, 2020). The difference in the rates of employment types is perhaps a more important factor to control for. Only 50% of women without children were in part-time employment before the Covid-19 pandemic, and only 20.3% of women with three or more children were in full-time employment – 20.2 percentage points lower than for women with one child (Hochlaf and Franklin, 2021). Only 10% of men were in part-time employment, which highlights the disparity in employment between men and women. Although there are large differences in employment rates, given the association between income and life expectancy, overall disposable household income is likely a better indicator that captures geographical heterogeneity in quality of life. Ahmed et al. (2022b) highlighted the differences in Covid-19 on mortality between ethnic minority groups. In comparison to White ethnic groups, all ethnic minority groups had higher rates of Covid-19 mortality, and Bangladeshi and Pakistani males had mortality rates significantly higher than all other groups. This is in stark contrast to pre-pandemic mortality rates, where the White group had significantly higher age-standardised mortality rates than all other ethnic groups (Cooke et al., 2021). The association found between ethnicity and all-cause excess mortality during the pandemic follows the ONS pandemic-trend, as a 10% increase in the proportion of non white ethnicities in a given Local Authority is associated with 0.222 more deaths per 10,000 people. Despite the positive relationship, the size of the effect is relatively small in comparison to the other variables that have been controlled for.
The share of the 65+ population has by far the largest relative effect on excess mortality rates. A 1% increase in the share of people aged 65 and over that are male is associated with an increase in the excess mortality rate of 0.706 deaths per 10,000. Although this association has been given as just a 1% increase, the range in the share of the 65+ population that is male is 7.9 percentage points, with a standard deviation of 0.927 (Table 1). In comparison, the share of the population aged 17 to 64 that is male is associated with a fall in the excess mortality rate; a 1% increase is associated with 0.627 fewer deaths per 10,000 people. This second result perhaps indicates that, although men experienced a 77% greater mortality risk from Covid-19, the indirect effects of the pandemic increased the mortality risk for women under 64 years old. The Office for National Statistics findings suggest that this could be an explanation for the results from Model b (Brain and Payne, 2021). Women’s well-being was more negatively affected than men’s during the pandemic, even though men experienced a higher Covid-19 mortality rate. This highlights the benefit of using all-cause excess mortality as the outcome of interest, as it can capture these indirect effects on mortality. In comparing population sizes of Local Authorities, a 10% increase is associated with 0.734 fewer deaths per 10,000 people. The direction of this effect is not as expected given that the infection rate has been found to increase with population size and density (Zhang et al., 2021), although it is difficult to control for these factors considering the biases present in Covid-19 data. It is also surprising that the effect of population density is not statistically different from zero as it would be expected that proximity, and therefore population density, increases the likelihood of transmission.
Rural-Urban Effect on Mortality
Controlling for the rural-urban classification of all Local Authorities could be a betterpredictor of excess mortality than population density as people tend to live further away from each other in rural areas, and are therefore likely to have lower levels of Covid-19 transmission. Sutton et al. (2020) suggest that a larger proportion of older people live in rural areas, while younger age groups are more concentrated in urban areas. They foundthat while Covid-19 infection rates were higher in urban areas due to their density, rural areas saw higher levels of consistent Covid-19 mortality rates. This could also help to explain the negative relationship between population size and excess mortality rates. Additionally, these findings and greater funding requirements for more sparsely populated areas, as outlined in the NHS CCG weighted population formulae, provide Controlling for the rural urban classification of all Local Authorities could be a better predictor of excess mortality than population density as people tend to live further away from each other in rural areas, and are therefore likely to have lower levels of Covid-19 transmission. Sutton et al. (2020) suggest that a larger proportion of older people live in
rural areas, while younger age groups are more concentrated in urban areas. They found that while Covid-19 infection rates were higher in urban areas due to their density, rural areas saw higher levels of consistent Covid-19 mortality rates. This could also help to explain the negative relationship between population size and excess mortality rates. Additionally, these findings and greater funding requirements for more sparsely populated areas, as outlined in the NHS CCG weighted population formulae, provide further evidence to support the positive effect of NHS CCG funding on excess mortality rates during the pandemic. This is a result of larger areas having “unavoidably higher costs of delivering health care due to location alone, known as the Market Forces Factor”(NHS_England, 2021b). Therefore, rural areas with a relatively larger proportion of old people and have higher funding requirements per person helps to explain the mechanisms that lead to the positive association between healthcare funding and mortality rates.
An alternate specification controlling for rural-urban classification, and an interaction variable of the rural-urban classification and the 60+ population variable can be seen in Table 4. This was included due to the relationship between rural areas and the proportion of old people highlighted by Sutton et al. (2020). The first stage regression remains the same but the second stage estimation can be defined as:
m
_
+𝛽7ln(𝑁𝑜𝑛𝑊ℎ𝑖𝑡𝑒)𝑖 +𝛽8ln(65𝑃𝑜𝑝𝑀𝑎𝑙𝑒)+𝛽9ln(𝑢65𝑃𝑜𝑝𝑀𝑎𝑙𝑒)
+𝛿.𝑟𝑢𝑟𝑎𝑙𝑖 ×ln(𝑂𝑙𝑑)𝑖 + 𝜖𝑖
Linear-Log IV-2SLS Model (Rural)

By controlling for the relationship between the proportion of old people andmore rural areas, we see that the impact of a 10% increase in NHS CCG funding on excess mortality rates falls by 0.427 deaths per 10,000 people, which is quite a substantial difference. This model likely captures some health risks due to old age and how rural a given area is with regards to funding levels based on need. However, the relationship we see in Table 4 suggests that increases in the number of older people living in more urban areas has a slightly larger effect on excess mortality than in more rural areas, a difference of 0.029 deaths per 10,000 people. This is likely linked to the extent of Covid 19 transmission in more urban areas that are more densely populated, but the very small difference in the excess mortality rates also suggests that the results are more likely due to the greater mortality risk for older people than the spatial and geographical characteristics of rural and urban areas.
Brandily et al. (2021) explain that the income gradient in mortality they find is robust to controlling for differences between rural and urban areas. Furthermore, they find that poor housing conditions explain the largest share of the income gradient that affects transmission. Dewilde (2021) outlines the trends in West-European countries of worsening living conditions for low-income households, but also explains that socioeconomic policies have a greater effect on living conditions than incomes. The housing-affordability ratio has been increasing in England and Wales, from roughly 3.5 to 9.1, in 1997 and 2021 respectively. This is a measure of the proportion of an individual’s annual earnings that they would typically expect to spend on purchasing a home (Smith, 2022). These increasing house prices in England link to further findings by Dewilde (2021), that increasing house prices over time are associated with worsening levels of living-conditions deprivation for renters and low-income earners. The direct of the effect of income on excess mortality found in Model c is therefore as expected, a 10% increase in income was associated with 0.507 fewer deaths per 10,000 people during the pandemic.
The share of non-white ethnic groups in a given Local Authority remains positive in Model c, but controlling for the rural-urban classification of Local Authorities has slightly reduced the size of this effect by 0.042 deaths per 10,000 people for a 10% increase in the share. Ethnic minority groups are still found to be disproportionately
affected by the pandemic despite the pre-pandemic trends of higher age-standardised mortality rates in White ethnic groups. Suleman et al. (2021) explain that the variation in the excess mortality rates of ethnic groups is not limited to between only White and non-White groups. In the first wave in 2020, Black African men were 3.7 times more likely to die than British White men, and during the second wave Bangladeshi men were 5 times more likely to die from Covid-19 than White men. Despite the greater mortality risk of non-White ethnic groups, the variation between these groups suggests that other socioeconomic factors are greater risk factors for Covid-19-related deaths, but these socioeconomic disadvantages can also be a result of institutional factors that are a detriment to non-White ethnic groups. A greater proportion of males in the 65+ population continues to have a strong effect on the excess mortality rate when controlling for rural and urban classifications, although the effect is slightly smaller when compared to Model b that controls for population density. The effect of an increase in the share of the 17-64 age group that is male remains negative as well, substantiating the earlier results and that younger women were indirectly affected to a greater extent by the pandemic, rather than through Covid-19 infections directly.
6. Strengths and Limitations
To some extent, the findings in this dissertation were initially unexpected but the underlying mechanisms that drive the results aid our understanding of these results. A large reason for the direction of the effects found on excess mortality could be a result of the instrumental variables method used in the analysis and the endogeneity issues that required the use of this method. NHS CCG funding, as explained by NHS England, is determined by a combination of the proportion of elderly within their area, poorer health, health inequalities, and areas with low population densities that consequently appear to have a larger proportion of old people (NHS_England, 2021b). Areas with a relatively high accumulation of health risk factors, and subsequent healthcare needs in more sparsely populated areas – that require extra infrastructure to ensure healthcare coverage of the entire local population – have higher levels of healthcare spending per person, which drives the positive association with excess mortality rates. The direction of the effect of population size on the excess mortality rate is also a curious finding, and so is the statistically insignificant effect of population density. There has been extensive research on the relationship between population density and Covid-19 mortality rates in OECD countries (Jahangiri et al., 2020, Dalziel et al., 2018). In particular, Pascoal and Rocha (2022) have found that there is a positive association between the two in France. Other research outlines the positive relationship between population size and transmission of Covid-19 that attempts to control for the intensity of quarantine, social distancing measures, and the proportion of the population vulnerable to serious cases of infection in different countries (Zhang et al., 2021). These findings were all determined using time-series analyses that have the benefit of being able to control for lockdown periods and other policy interventions to limit the spread of the virus, a disadvantage of the IV approach used in this dissertation. Data limitations of population data at the LSOA level meant that population size and demographic changes could not be controlled for due to the variation of CCG funding within many Local Authorities. Another limitation of the approach used in this dissertation compared to a time series approach, is that vaccination rates in local authorities could not be controlled for since they changed significantly over time. On 1st January 2021, the average first and second vaccination dose uptake percentages in England were 2.15% and 0.03% respectively. On 1st January 2022, the first and second dose uptakes were at 81.72% and 75.67% respectively, with an additional third dose uptake of 56.56%. Over the course of a single year, the vaccination rate in England changed drastically, so it was difficult to control for without using a time-series approach. Using a similar difference-in difference approach to Brandily et al. (2021) of separating Local Authorities into deciles or quartiles by NHS CCG funding, or Local Authority spending, could have provided further insight into the public and health expenditure gradient in mortality. However, the findings imply that the total effect of Local Authority and NHS CCG spending is less than the total effect of the remaining variables, but it does not at all suggest that spending is unimportant in understanding the heterogeneity in the excess mortality rate in England.
Linear-Log OLS – Model d
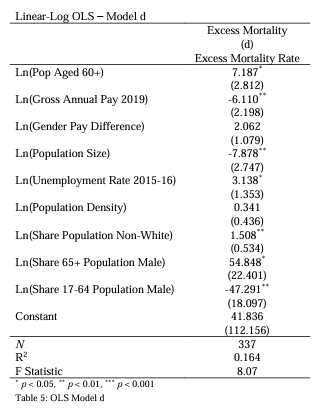

A basic comparison of both Model b and Model c to an OLS model that excludes NHS CCG funding and Local Authority spending (Table 5) highlights their impact on the all-cause excess mortality rate. We see that the magnitude of the effects on the excess mortality rate increase for almost all regressors in the Model d; the estimated coefficients of the variables are overestimated. Including health and social care spending in the model appears to partly absorb the effects of other factors on mortality rates, possibly a result of need-based spending that benefits disadvantaged groups to a relatively greater extent. Interestingly, the effect of the unemployment rate in 2015 becomes statistically significant when spending is not included. However, this does not necessarily contradict previous research on the negative relationship of long-term, or historical, unemployment on health outcomes, but could instead suggest that the welfare-regime in the UK provides enough support to the unemployed to reduce the consequences on their health (McLeod et al., 2012).
7. Conclusion
Despite the limitations and constraints of Instrumental Variables models, this analysis has been able to show that both health and social care spending have had significant effects on the all-cause excess mortality rate throughout the pandemic. An increase in NHS CCG funding of 10% is associated with 1.874 to 1.448 more deaths per 10,000 people, while the same increase in Local Authority spending is associated with 0.419 to 0.442 fewer deaths per 10,000 people, when controlling for population density and rural-urban classification, respectively. It seems clear that more government funding for Local Authorities is needed to allow them to provide services to the population at a local level – services that have clear benefits to the most disadvantaged groups, regardless of
ethnicity or gender. Spending on these services indirectly improves health outcomes of these groups through various mechanisms. Reductions in unemployment rates, especially for women, lead to increases in income levels and reductions in gender pay differences. Improvements to healthy life expectancies will allow elderly people to live independently for longer. These mechanisms are likely to significantly reduce the overall strain on the NHS.
Increases to NHS CCG funding are likely to improve health outcomes, despite the positive association with excess mortality rates, provided that the increases to funding are targeted towards preventative measures of health care. The current need-based funding methods appear to be the driving force for this surprising positive association with mortality rates, even when controlling for factors that influence health outcomes.
There are a wide variety of environmental and lifestyle factors that can influence both historical and current spending on health and social care. Controlling for these factors is particularly difficult for determining the true impact of the pandemic on the public and health expenditure gradient in mortality – housing conditions and the number of people living in a house can vary between both cultures and regions. Cultural differences between Local Authorities, or even regions, can alter the measured outcomes on excess mortality rates, either through the population’s behaviour, or the institutions that implemented policies to minimise transmission of Covid-19, and deaths from Covid-19 infections. As a simple comparison, as of August 2022 China still requires testing prior to international travel and on arrival, with a minimum of 10 days quarantine (FCDO). The United Kingdom discontinued mass testing and the legal obligation to self isolate in the case of a positive Covid-19 test at the end of March 2022, and does not require anyone flying into the UK to test either before or after arrival (DfT and DHSC, 2022). Despite the contrasting policy approaches between these two countries, it aims to highlight the differences that culture or institutions can have on mortality rates and the different ways in which the excess mortality rate can be influenced through the health of the population.
Although health and social care spending is the focus of this dissertation, the findings suggest they are not the biggest contributors to inequalities in all-cause excess mortality during the Covid-19 pandemic. While health, income and socioeconomic inequalities appear to be better predictors of mortality rates, health and social care spending are still important to consider as their spending is target towards reducing the extent of these inequalities and therefore their impact on mortality. Understanding how spending has historically targeted the most disadvantaged areas, how funding is provisioned in the case of Local Authorities in England in particular, and the contexts of the inequalities discussed in this dissertation, are vital in understanding the mechanisms through which Covid-19 affects mortality rates with respect to health and social care spending.
Bibliography
Ahmed, T., Drummond, R. & Bosworth, M. 2022a. Updating ethnic contrasts in deaths involving the coronavirus (COVID-19), England: 8 December 2020 to 1 December 2021 [Online]. Office for National Statistics. Available:
https://www.ons.gov.uk/peoplepopulationandcommunity/birthsdeathsandmar
riages/deaths/articles/updatingethniccontrastsindeathsinvolvingthecoronaviru
scovid19englandandwales/8december2020to1december2021 [Accessed 23rd August 2022].
Ahmed, T., Drummond, R. & Bosworth, M. 2022b. Updating ethnic contrasts in deaths involving the coronavirus (COVID-19), England: 10 January 2022 to 16 February 2022 [Online]. Office for National Statistics. Available:
https://www.ons.gov.uk/peoplepopulationandcommunity/birthsdeathsandmar riages/deaths/articles/updatingethniccontrastsindeathsinvolvingthecoronaviru scovid19englandandwales/10january2022to16february2022 [Accessed 18th August 2022].
Atkins, J. L., Masoli, J. A. H., Delgado, J., Pilling, L. C., Kuo, C.-L., Kuchel, G. A. & Melzer, D. 2020. Preexisting Comorbidities Predicting COVID-19 and Mortality in the UK Biobank Community Cohort. The Journals of Gerontology: Series A, 75, 2224 2230. Benzeval, M., Booker, C., Burton, J., Crossley, T., Jäckle, A., Kumari, M. & Read, B. 2020. Understanding Society COVID-19 Survey. April Briefing Note: Health and Caring, Understanding Society. ISER, University of Essex. Biswas, M., Rahaman, S., Biswas, T. K., Haque, Z. & Ibrahim, B. 2021. Association of Sex, Age, and Comorbidities with Mortality in COVID-19 Patients: A Systematic Review and Meta-Analysis. Intervirology, 64, 36-47. Brain, M. & Payne, C. 2021. Coronavirus (COVID-19) and the different effects on men and women in the UK, March 2020 to February 2021 [Online]. Office for National Statistics. Available:
https://www.ons.gov.uk/peoplepopulationandcommunity/healthandsocialcare /conditionsanddiseases/articles/coronaviruscovid19andthedifferenteffectsonm enandwomenintheukmarch2020tofebruary2021/2021-03-10 [Accessed 18th August 2022]. Brandily, P., Brebion, C., Briole, S. & Khoury, L. 2021. A poorly understood disease? The impact of COVID-19 on the income gradient in mortality over the course of the pandemic. European Economic Review, 140, 28. Breen, R. & Ermisch, J. 2021. The distributional impact of COVID-19: Geographic variation in mortality in England. Demographic Research, 44, 397 414. Caul, S. 2022. Deaths registered weekly in England and Wales, provisional [Online]. Office for National Statistics. Available: https://www.ons.gov.uk/peoplepopulationandcommunity/birthsdeathsandmar riages/deaths/bulletins/deathsregisteredweeklyinenglandandwalesprovisional/ latest [Accessed]. Challen, R., Brooks-Pollock, E., Read, J. M., Dyson, L., Tsaneva-Atanasova, K. & Danon, L. 2021. Risk of mortality in patients infected with SARS-CoV-2 variant of concern 202012/1: matched cohort study. BMJ, 372, n579. Chetty, R., Stepner, M., Abraham, S., Lin, S., Scuderi, B., Turner, N., Bergeron, A. & Cutler, D. 2016. The Association Between Income and Life Expectancy in the United States, 2001-2014. Jama-Journal of the American Medical Association,
315, 1750-1766. Cho, S. I., Yoon, S. & Lee, H.-J. 2021. Impact of comorbidity burden on mortality in patients with COVID-19 using the Korean health insurance database. Scientific Reports, 11, 6375. Cooke, A., Butt, A., Nasir, R. & Windsor-Shellard, B. 2021. Mortality from leading causes of death by ethnic group, England and Wales: 2012 to 2019 [Online]. Office for National Statistics. Available: https://www.ons.gov.uk/peoplepopulationandcommunity/birthsdeathsandmar riages/deaths/articles/mortalityfromleadingcausesofdeathbyethnicgroupengla ndandwales/2012to2019 [Accessed 18th August 2022]
Atkins, J. L., Masoli, J. A. H., Delgado, J., Pilling, L. C., Kuo, C.-L., Kuchel, G. A. & Melzer,
D. 2020. Preexisting Comorbidities Predicting COVID-19 and Mortality in the UK
Biobank Community Cohort. The Journals of Gerontology: Series A, 75, 2224
2230.
Benzeval, M., Booker, C., Burton, J., Crossley, T., Jäckle, A., Kumari, M. & Read, B. 2020.
Understanding Society COVID-19 Survey. April Briefing Note: Health and Caring,
Understanding Society. ISER, University of Essex.
Biswas, M., Rahaman, S., Biswas, T. K., Haque, Z. & Ibrahim, B. 2021. Association of
Sex, Age, and Comorbidities with Mortality in COVID-19 Patients: A Systematic
Review and Meta-Analysis. Intervirology, 64, 36-47.
Brain, M. & Payne, C. 2021. Coronavirus (COVID-19) and the different effects on men
and women in the UK, March 2020 to February 2021 [Online]. Office for
National Statistics. Available:
https://www.ons.gov.uk/peoplepopulationandcommunity/healthandsocialcare
/conditionsanddiseases/articles/coronaviruscovid19andthedifferenteffectsonm
enandwomenintheukmarch2020tofebruary2021/2021-03-10 [Accessed 18th
August 2022].
Brandily, P., Brebion, C., Briole, S. & Khoury, L. 2021. A poorly understood disease? The
impact of COVID-19 on the income gradient in mortality over the course of the
pandemic. European Economic Review, 140, 28.
Breen, R. & Ermisch, J. 2021. The distributional impact of COVID-19: Geographic
variation in mortality in England. Demographic Research, 44, 397-414.
Caul, S. 2022. Deaths registered weekly in England and Wales, provisional [Online].
Office for National Statistics. Available:
https://www.ons.gov.uk/peoplepopulationandcommunity/birthsdeathsandmar
riages/deaths/bulletins/deathsregisteredweeklyinenglandandwalesprovisional/
latest [Accessed].
Challen, R., Brooks-Pollock, E., Read, J. M., Dyson, L., Tsaneva-Atanasova, K. & Danon,
L. 2021. Risk of mortality in patients infected with SARS-CoV-2 variant of
concern 202012/1: matched cohort study. BMJ, 372, n579.
Chetty, R., Stepner, M., Abraham, S., Lin, S., Scuderi, B., Turner, N., Bergeron, A. &
Cutler, D. 2016. The Association Between Income and Life Expectancy in the
United States, 2001-2014. Jama-Journal of the American Medical Association,
315, 1750-1766.
Cho, S. I., Yoon, S. & Lee, H.-J. 2021. Impact of comorbidity burden on mortality in
patients with COVID-19 using the Korean health insurance database. Scientific
Reports, 11, 6375.
Cooke, A., Butt, A., Nasir, R. & Windsor-Shellard, B. 2021. Mortality from leading
causes of death by ethnic group, England and Wales: 2012 to 2019 [Online].
Office for National Statistics. Available:
https://www.ons.gov.uk/peoplepopulationandcommunity/birthsdeathsandmar
riages/deaths/articles/mortalityfromleadingcausesofdeathbyethnicgroupengla
ndandwales/2012to2019 [Accessed 18th August 2022].
Cooper, D., McCausland, W. D. & Theodossiou, I. 2006. The health hazards of
unemployment and poor education: The socioeconomic determinants of health
duration in the European Union. Economics & Human Biology, 4, 273-297.
Dalziel, B. D., Kissler, S., Gog, J. R., Viboud, C., Bjørnstad, O. N., Metcalf, C. J. E. &
Grenfell, B. T. 2018. Urbanization and humidity shape the intensity of influenza
epidemics in U.S. cities. Science, 362, 75-79.
Decoster, A., Minten, T. & Spinnewijn, J. 2021. The Income Gradient in Mortality during
the Covid-19 Crisis: Evidence from Belgium. J Econ Inequal, 19, 551-570.
Dewilde, C. 2021. How housing affects the association between low income and living
conditions-deprivation across Europe. Socio-Economic Review, 20, 373-400.
DfT & DHSC. 2022. Travel to England from another country during coronavirus (COVID
19) [Online]. Department for Transport, Department of Health and Social Care.
Available: https://www.gov.uk/guidance/travel-to-england-from-another
country-during-coronavirus-covid-19 [Accessed 19th August 2022].
DLUHC. 2015. English Indices of Deprivation 2015 – LSOA Level [Online]. Department
for Levelling Up, Housing & Communities. Available:
https://www.data.gov.uk/dataset/8f601edb-6974-417e-9c9d
85832dd2bbf2/english-indices-of-deprivation-2015-lsoa-level [Accessed 7th
August 2022].
DLUHC 2019. The Local Government Finance Report (England) 2019/2020. London,
England: Department for Levelling Up, Housing & Communities.
Edwards, N. 2020. Here to stay? How the NHS will have to learn to live with coronavirus
[Online]. Nuffield Trust. Available:
https://www.nuffieldtrust.org.uk/resource/here-to-stay-how-the-nhs-will
have-to-learn-to-live-with-coronavirus [Accessed 23rd August 2022].
FCDO. Foreign Travel Advice: China [Online]. Foreign, Commonwealth & Development
Office. Available: https://www.gov.uk/foreign-travel-advice/china/entry
requirements#entry-rules-in-response-to-coronavirus-covid-19 [Accessed 19th
August 2022].
Gallagher, J. 2021. Omicron: Good news, bad news and what it all means. Available
from: https://www.bbc.co.uk/news/health-59769967.
Gray, M. & Barford, A. 2018. The depths of the cuts: the uneven geography of local
government austerity. Cambridge Journal of Regions Economy and Society, 11,
541-563.
Haddon, C., Sasse, T. & Tetlow, G. 2021. Lifting lockdown in 2021: The next phase of
the government’s coronavirus strategy [Online]. Institute for Government.
Available: https://www.instituteforgovernment.org.uk/publications/lifting
lockdown [Accessed 9th August 2022].
Haque, Z., Becares, L. & Treloar, N. 2020. Over-Exposed and Under-Protected: The
Devastating Impact of COVID-19 on Black and Minority Ethnic Communities in
Great Britain. Runnymede Trust.
Harris, T., Hodge, L. & Phillips, D. 2019. English local government funding: trends and
challenges in 2019 and beyond. London, England: The Institute for Fiscal
Studies.
Hochlaf, D. & Franklin, B. 2021. Women in the labour market: Boosting mothers’
employment and earnings through accessible childcare. London, England:
Centre for Progressive Policy.
Jahangiri, M., Jahangiri, M. & Najafgholipour, M. 2020. The sensitivity and specificity
analyses of ambient temperature and population size on the transmission rate
of the novel coronavirus (COVID-19) in different provinces of Iran. Science of
The Total Environment, 728, 138872.
James, C., Devaux, M. & Sassi, F. 2017. Inclusive growth and health. OECD Health
Working Papers.
Knapton, S. 14th September 2021 2021. Booster vaccine offered to over-50s within
days. Available from: https://www.telegraph.co.uk/news/2021/09/14/booster
vaccine-offered-over-50s-within-days/.
Larsen, T., Bosworth, M. & Nafilyan, V. 2021. Updating ethnic contrasts in deaths
involving the coronavirus (COVID-19), England: 24 January 2020 to 31 March
2021 [Online]. Office for National Statistics. Available:
https://www.ons.gov.uk/peoplepopulationandcommunity/birthsdeathsandmar
riages/deaths/articles/updatingethniccontrastsindeathsinvolvingthecoronaviru
scovid19englandandwales/24january2020to31march2021 [Accessed 23rd
August 2022].
Lewis, A. 2021. Housing an ageing population: a reading list. In: LIBRARY, H. O. C. (ed.).
House of Commons Library.
LGA 2019. Demonstrating the beneficial impact of local government spending. London,
England: Local Government Association.
McLeod, C. B., Lavis, J. N., MacNab, Y. C. & Hertzman, C. 2012. Unemployment and
self-reported health status: a comparative study of Canada, Germany and the
United States. European Journal of Public Health, 22, 27-28.
Meyers, M., Rosenbaum, D., Ruhm, C. & Waldfogel, J. 2004. Inequality in early
childhood education and care: What do we know? Social Inequality, 223-269.
NHS_England. 2020. Hospitals to start biggest ever NHS Vaccination Programme this
week [Online]. NHS England. Available:
https://www.england.nhs.uk/2020/12/hospitals-to-start-biggest-ever-nhs
vaccination-programme-this-week/ [Accessed].
NHS_England 2021a. Frontline social care workers standard operating procedure –
updated to reflect phase 3 of the COVID-19 vaccination programme. In: CARE,
D. O. H. S. (ed.). NHS England, Directors of Adult Social Services, Local
Government Association.
NHS_England 2021b. Technical Guide to Allocation Formulae and Convergence: For
2022/23 to 2024/25 revenue allocations Technical Guide to Allocation Formulae
and Convergence. NHS England and Improvement.
Nyberg, T., Ferguson, N. M., Nash, S. G., Webster, H. H., Flaxman, S., Andrews, N.,
Hinsley, W., Bernal, J. L., Kall, M., Bhatt, S., Blomquist, P., Zaidi, A., Volz, E., Aziz,
N. A., Harman, K., Funk, S., Abbott, S., Hope, R., Charlett, A., Chand, M., Ghani,
A. C., Seaman, S. R., Dabrera, G., De Angelis, D., Presanis, A. M. & Thelwall, S.
2022. Comparative analysis of the risks of hospitalisation and death associated
with SARS-CoV-2 omicron (B.1.1.529) and delta (B.1.617.2) variants in England:
a cohort study. Lancet, 399, 1303-1312.
Nyberg, T., Twohig, K. A., Harris, R. J., Seaman, S. R., Flannagan, J., Allen, H., Charlett,
A., De Angelis, D., Dabrera, G. & Presanis, A. M. 2021. Risk of hospital admission
for patients with SARS-CoV-2 variant B.1.1.7: cohort analysis. Bmj, 373, n1412.
Papageorge, N. W., Zahn, M. V., Belot, M., van den Broek-Altenburg, E., Choi, S.,
Jamison, J. C. & Tripodi, E. 2021. Socio-demographic factors associated with
self-protecting behavior during the Covid-19 pandemic. J Popul Econ, 34, 691
738.
Pascoal, R. & Rocha, H. 2022. Population density impact on COVID-19 mortality rate: A
multifractal analysis using French data. Physica A: Statistical Mechanics and its
Applications, 593, 126979.
Paun, A., Hall, D. & Wilson, J. 2022. Local government [Online]. Institute for
Government. Available:
https://www.instituteforgovernment.org.uk/explainers/local-government
[Accessed 20th August 2022].
Perry, S. 2021. Latest figures suggest the NHS is being tested to its very limits [Online].
The Health Foundation. Available: https://www.health.org.uk/news-and
comment/news/latest-figures-suggest-the-nhs-is-being-tested-to-its-very-limits
[Accessed 23rd August 2022].
Pitas, C., Chambers, M. & Sterling, T. 28th November 2021 2021. UK, Germany and
Italy detect Omicron variant cases, Israel closes borders. Available from:
https://www.reuters.com/world/concerns-over-covid-variant-trigger-more
travel-curbs-southern-africa-2021-11-27/.
Pratt, M. 2018. Health state life expectancies, UK: 2015 to 2017 [Online]. Office for
National Statistics. Available:
https://www.ons.gov.uk/peoplepopulationandcommunity/healthandsocialcare
/healthandlifeexpectancies/bulletins/healthstatelifeexpectanciesuk/2015to201
7 [Accessed 17th August 2022].
Rosengren, H. 2022. 14.9 million excess deaths associated with the COVID-19
pandemic in 2020 and 2021, World Health Organisation. Available from:
https://www.who.int/news/item/05-05-2022-14.9-million-excess-deaths-were
associated-with-the-covid-19-pandemic-in-2020-and-2021 [Accessed 20th
August 2022].
SAGE 2021. SPI-M-O: Consensus Statement on COVID-19. In: SPI-M-O (ed.). Scientific
Advisory Group for Emergencies.
Sandle, P. & Smout, A. 7th May 2021 2021. Britain labels coronavirus “variant of
concern” linked to travel from India. Available from:
https://www.reuters.com/world/uk/british-officials-warn-over-indian
coronavirus-variant-reports-2021-05-07/.
Scobie, S. 2021. Will the third Covid-19 wave overwhelm the NHS? [Online]. Nuffield
Trust. Available: https://www.nuffieldtrust.org.uk/news-item/will-the-third
covid-19-wave-overwhelm-the-nhs [Accessed 23rd August 2022].
Sheikh, A., McMenamin, J., Taylor, B., Robertson, C., Public Health, S. & the, E. I. I. C.
2021. SARS-CoV-2 Delta VOC in Scotland: demographics, risk of hospital
admission, and vaccine effectiveness. Lancet, 397, 2461-2462.
Smith, C. 2022. Housing affordability in England and Wales: 2021 [Online]. Office for
National Statistics. Available:
https://www.ons.gov.uk/peoplepopulationandcommunity/housing/bulletins/h
ousingaffordabilityinenglandandwales/2021 [Accessed 19th August 2022].
Smith, R. 2020. Gender pay gap in the UK: 2020 [Online]. Office for National Statistics.
Available:
https://www.ons.gov.uk/employmentandlabourmarket/peopleinwork/earnings
andworkinghours/bulletins/genderpaygapintheuk/2020 [Accessed 16th August
2022].
Stafford, M., Steventon, A., Thorlby, R., Fisher, R., Turton, C. & Deeny, S. 2018. Briefing:
Understanding the health care needs of people with multiple health conditions.
The Health Foundation.
Suleman, M., Sonthalia, S., Webb, C., Tinson, A., Kane, M., Bunbury, S., Finch, D. &
Bibby, J. 2021. Unequal pandemic, fairer recovery: The COVID-19 impact inquiry
report. The Health Foundation.
Sutton, J., Shahtahmassebi, G., Ribeiro, H. V. & Hanley, Q. S. 2020. Rural–urban scaling
of age, mortality, crime and property reveals a loss of expected self-similar
behaviour. Scientific Reports, 10, 16863.
UKHSA. 2022a. Coronavirus (COVID-19) in the UK [Online]. GOV.UK. Available:
https://coronavirus.data.gov.uk/ [Accessed].
UKHSA 2022b. SARS-CoV-2 variants of concern and variants under investigation in
England. In: AGENCY, U. H. S. (ed.) 44 ed.: UK Health Security Agency.
Vassilev, G. 2021. Which groups find it hardest to find a job following a period out of
work? [Online]. Office for National Statistics. Available:
https://www.ons.gov.uk/employmentandlabourmarket/peoplenotinwork/une
mployment/articles/whichgroupsfindithardesttofindajobfollowingaperiodoutof
work/2021-03-30 [Accessed 16th August 2022].
Watkins, J., Wulaningsih, W., Da Zhou, C., Marshall, D. C., Sylianteng, G. D. C., Dela
Rosa, P. G., Miguel, V. A., Raine, R., King, L. P. & Maruthappu, M. 2017. Effects
of health and social care spending constraints on mortality in England: a time
trend analysis. Bmj Open, 7, 9.
Watt, T., Charlesworth, A. & Gershlick, B. 2019. Health and care spending and its value,
past, present and future. Future Healthcare Journal, 6, 99-105.
Wellard, N. 2022. Socioeconomic inequalities in avoidable mortality in England: 2020
[Online]. Office for National Statistics. Available:
https://www.ons.gov.uk/peoplepopulationandcommunity/birthsdeathsandmar
riages/deaths/bulletins/socioeconomicinequalitiesinavoidablemortalityinengla
nd/2020 [Accessed 12th August 2022].
White, C. 2022. Health state life expectancies, UK: 2018 to 2020 [Online]. Office for
National Statistics. Available:
https://www.ons.gov.uk/peoplepopulationandcommunity/healthandsocialcare
/healthandlifeexpectancies/bulletins/healthstatelifeexpectanciesuk/2018to202
0 [Accessed 17th August 2022].
WHO 2022. Weekly epidemiological update on COVID-19 – 6 January 2022. World
Health Organisation.
Williamson, E. J., Walker, A. J., Bhaskaran, K., Bacon, S., Bates, C., Morton, C. E., Curtis,
H. J., Mehrkar, A., Evans, D., Inglesby, P., Cockburn, J., McDonald, H. I.,
MacKenna, B., Tomlinson, L., Douglas, I. J., Rentsch, C. T., Mathur, R., Wong, A.
Y. S., Grieve, R., Harrison, D., Forbes, H., Schultze, A., Croker, R., Parry, J.,
Hester, F., Harper, S., Perera, R., Evans, S. J. W., Smeeth, L. & Goldacre, B. 2020.
Factors associated with COVID-19-related death using OpenSAFELY. Nature,
584, 430-436.
Yanez, N. D., Weiss, N. S., Romand, J. A. & Treggiari, M. M. 2020. COVID-19 mortality
risk for older men and women. BMC Public Health, 20, 1742.
Zhang, X., Liu, H., Tang, H., Zhang, M., Yuan, X. & Shen, X. 2021. The effect of
population size for pathogen transmission on prediction of COVID-19 spread.
Scientific Reports, 11, 18024.
